


Trading Levels: Avoiding The Chop
Special Episode

There are many different ways to become a consistent and successful day trader, some people trade using the opening range of a session. Others will trade based on higher timeframe confirmations. Personally, the methods I have found that work for me best is trading levels that are predefined. You can read about the levels I have on my charts here.
Simply put, being a levels trader means you look for price discovery on an intraday basis. This means that you buy low and sell high or vice versa, but more importantly as a levels trader you avoid consolidation periods, you avoid the chop like the plague.
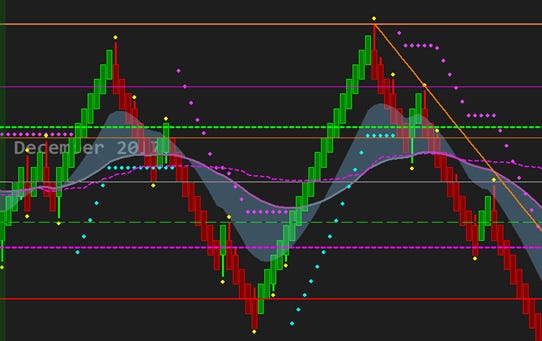
Being stuck in chop means you get yourself stopped out, only for price to go back to a level that you initially thought acceptable. Therefore, a newbie would most likely re-enter the trade and price would go down again chopping them out again, repeat the process until you have death by a thousand cuts. Choppy intraday price action can look a little like this:
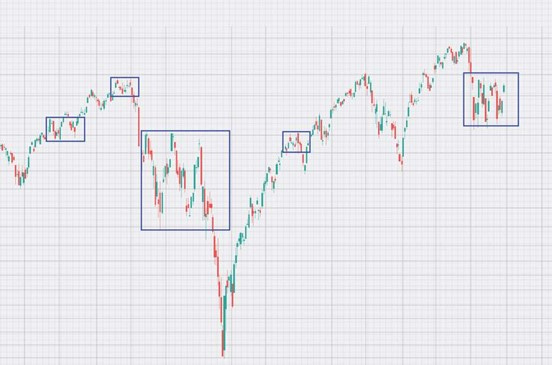
Here we have identified areas where price is consolidating. Buyers and sellers are working each other out. As this happens, the price fluctuates in an area before reversing its direction with little warning. We want to avoid areas with this constant up down movement. They are money losing zones and the longer you are stuck in chop the more anxious you become of your position.
In today’s blog we take a look at how you can avoid being stuck in price consolidation, and try to find out how can you identify price discovery and ride the trend.
Firstly, this episode assumes that you have already read my trading methods post. As such, I won’t spend time talking about where to take best entries or how to ensure a good stop loss. Instead, we are going to focus on trends or what I call intraday price discovery, how best to detect a trend is inbound and then how to exploit this trend by taking a position.
Out Of Whack Detection
One of the little spoken about methods of detecting a trend before it happens is looking at securities that are tied to ES that influence its price. Many traders keep a separate window open for treasury bonds and the likes but personally I prefer the following:
· US Dollar Index (DXY)
· NQ
· Australian Dollar vs US Dollar
· Tick
· VIX
When any of the above begin to become misaligned with the price action on ES, it is more often than not an indication that “rebalancing” is about to happen and price will go on a journey of discovery to find balance once again.
Using Sierra Charts and thanks to the friends and relationships we have made in the Walnut Discord, I have the following setup for each of these that allows me to detect the possibility of price discovery:
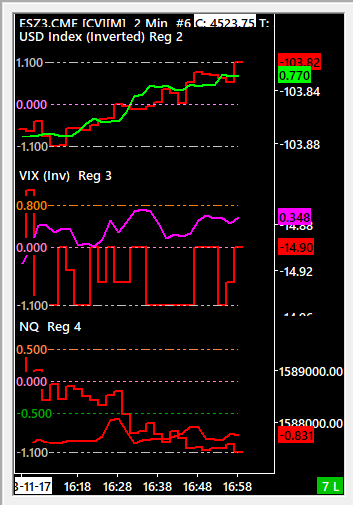
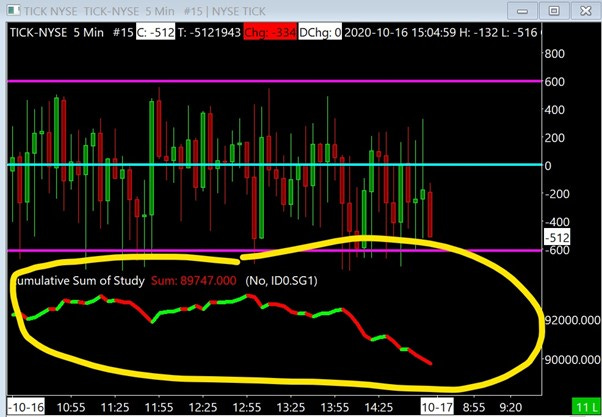
When price begins to come into a key area for our walnut levels and we notice the linked securities becoming out of sync with price, we can often deduce the incoming move’s direction and think about the best place to take a direction. Similarly, one can create such charts for TICK in a similar way:
Following The Trend
Okay, so let’s say we have all these things up on our screens and we see that tick has begun to drop but ES remains where it is, or that NQ has made a higher low and is starting to move up whilst ES continues to make lower lows. We know that ES will begin to correct itself in these securitie’s direction, or vice versa. Once we begin to see the move come in, how and when should we take the position?
The answer to this is multifaceted, readers could choose to do any of the following and none of them would be wrong:
· Ride the trend to your predefined targets whilst trailing your stop
· Have a predefined target 1 and 2 whilst leaving a runner
· Collect a break even amount at the start of the move and keep the remainder for the trend ride
The last two methods defined above are the ones that will make you the most money, so if you choose to do these how can you ensure you ride the full(ish) trend?
Again, there is no one-size-fits-all answer to this, but I will show you what has worked for me and what has worked for others in our discord. The first example is simple, using the 3 minute time frame, lets apply Heikenashi candles to our chart.
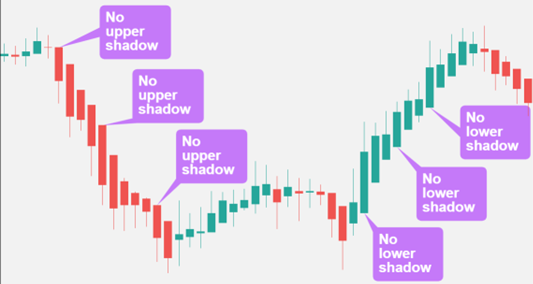
The above image should be pretty self-explanatory, once we enter a trend the HK candles help us smooth out the price action and allow us to begin to see how they start and finish. As well as HK candles, I have recently added Renko candles to my setup:
Both the HK candles and the Renko have one fundamental flaw which is that they redraw the candles on close, often this means that they are lag measures, but as you can see from the example above, they allow us to neaten price discovery so that we are able to avoid the chop of intraday consolidation.
Whatever systems you use or don’t use for your trend riding, it is important to remember that our number 1 priority is always to get the best entry we possibly can, often at the point where failure of the move would begin to unfold. You should also always keep in mind that a well disciplined trader is not trying to catch the top or bottom of the move. We are waiting for the trend to reveal itself, and we take a position on confirmation, never on gut.
Until next time, much love.
PW.
What Is Apex Prop Trading?
Don’t risk your own money until you are a consistent trader. Use Apex instead for as little as $20 a month. I found my consistency using them. I wrote about it in detail here.
Click here to find out more and get a 90% lifetime discount with code UDIUNIWD
What are Walnut Footprints & Sierra Chart?
I explain how to read my footprint chart here. You can download and use it for free!
I wrote a detailed breakdown of how to sign up for a 14 day free trial of Sierra here.
How Do I Get Into The Walnut Discord?
I want to grow our discord communities (clubs) so that they are self sufficient and a place of safety for newcomers. To do this we operate under a slow-growth policy, but to be added to the waiting list click here.