Dear Reader,
I wanted to spend some time today talking to you about my latest tool in helping me make informed trading decisions. I have included footprint charts in a few of my reviews but have yet to fully explain the how’s and why’s behind their use.
Before I begin, I am by no means an expert in footprints or order flow tools. I have spent the best part of the last three months reading about them, watching delayed feeds and end of day examples before finally taking the plunge and incorporating them into my system. What I give you today is my commoner’s take on a tool that is used by professional and amateurs alike.
Walnut Footprints
There are a million different ways that you can setup your footprint candle. It can give you all sorts of data in both graphical and tabular form. Over the last three months I have refined my preferences and this is my current version that I am content with for now:
Candle Body: I use the 5-minute time frame for my footprints, so this is the 5-minute candle’s body.
Candle Volume Profile: This shows you where sell side (red) and buy side (blue) activity took place
Candle VPOC: The yellow highlighted box shows you where the most volume was for this candle.
Stacked Imbalance: These are where aggressive orders took place, sweep to fill type transactions.
Imbalance Markers: These allow you to track imbalances forwards until they are touched by price.
Prior Imbalance Markers: These are old imbalances that have now been touched by price.
Large Single Transactions: These are large market orders either ask side or bid side.
Candle Delta: Difference between market buys and market sells for this candle.
You can see straight away, the level of data available about this one candle, has increased exponentially. But how on earth can you use this data to actually help you with your entries and exits? Let’s dive deeper and find out.
Buyers & Sellers Defend Their Positions
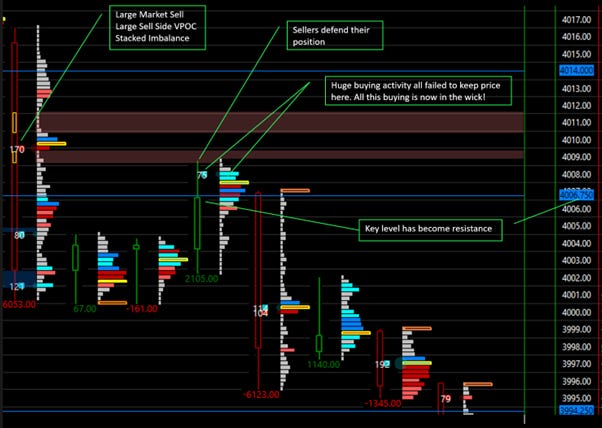
Let’s have a look at what happened to price after this large bearish candle:
Let’s break down that green candle above that I have annotated some more:
Candle Delta: 2105, massively positive. Buyers turned up.
Candle Body: You can see how the green candle’s upper wick is perfectly aligned 4006.
Candle Volume Profile: P shaped profile shows buyers tried and failed to take us higher.
Candle VPOC: Huge buying volume, but it failed – VPOC is in the wick. Sellers won.
Imbalance Markers: These were not breached. Sellers are in control.
Large Single Transactions: Possible huge buying failed. Could also have been a passive seller, but that’s’ for another episode!
If you are a large player in the market, you won’t easily allow your position to be taken out. Large institutional players have enough powder to not only take a position but then defend that position with either resting orders or aggressive market orders. The above footprint data, combined with my key levels is a picture perfect example of how order flow data can help you further refine your decision making.
The selling continued all the way down to 3973. Let’s look at what happened down there:
Here is the market about an hour later. Stop reading for a moment guys and just take a look at the footprints above. What do you see? Here are some questions:
How much red delta is there?
Are there any large transactions? Sell side or buy side?
What is the dominant market profile colour?
What do the large candle bodies/wicks indicate overall?
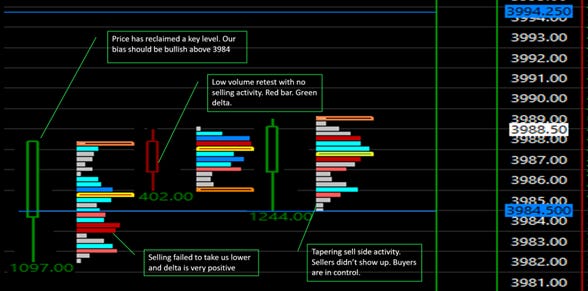
The answers to the above questions should give you the bias you need. It looks like we are going to have some degree of a reversal to the upside. Buyers are showing up. I want to zoom in on the last three candles in the picture above:
Once again, you can see the correlation between my key levels and the footprint candles. If we have broken below a key level, we are bearish. If we are above it, we are bullish. In both cases however, we are waiting for confirmation. Waiting for the market to tell us if sellers or buyers are in control.
If you have a keen eye, you will have noticed I have not explained what those orange boxes are at the top of our two green candles. These are unfinished auctions but are more useful on larger timeframes so I have not discussed these today.
Look at where this reversal ended up:
Right back at the stacked imbalances from above 4006. There’s a reason why I project those levels forwards, these areas can be used as targets for profit taking if you can stomach holding onto your position for that long. I know I can’t but I am working on it!
Okay, I hope you are able to learn from these two great examples from the last couple of weeks of where my key levels and my footprints have allowed me to get a great idea of what price is doing.
I will remind readers of what I wrote in episode 15 of my market probe:
I have spent years learning the above, getting to know each element mathematically as well as contextually. I have now started on a new hierarchy of learning, this time with footprints forming the base of my learning. This weekend I have spent my free time reading about market internals and how they can add even more information to my decision making. That is what I will be dedicating the next few months learning and back testing before finally including them in my process and then later sharing them with you.
I am really excited about the journey I am on, my appetite for knowledge grows with each new element I learn and I am both humbled and grateful that you have firstly read my special episode up until this point! And secondly that you are sharing this journey with me. Thank you.
Sincerely. PW
You can download my footprint chart for free here.
I use Sierra Charts for my order flow analysis. You can sign up here.
I found my consistency using Apex Prop Trading. Click here to find out more and get a 50% discount. I wrote about it in detail here.


Very strong explanation of your footprint chart - easy to understand. I’m actually excited by learning your setup rather than feeling completely overwhelmed. Thank you
This is FANTASTIC. Just found my way back here thanks to the linktree. I remembered liking it and wanting to come back to dig into it and next thing you know it's July. Thank you for sharing all of this, you are giving an amazing crash course. Thanks to you I got my apex going and am finally moving in the right direction. The dream is 5 funded accounts and nice easy patient trades. I'll get there. Before the walnuts I had no direction at all as I watched my account slim down. This is just amazing tho I still have so much to learn.