


Why Has It Been So Hard?
Special Episode: Trading The Whiplash

Trading The Whiplash: Chapter 1
In my new three part series, I will be trying to answer a question many of you have asked me:
Why has it been so hard?
This is question I have been asked a lot in the last few weeks. People who have been trying to follow the rules find themselves stopped out again and again eventually seeing their accounts die a death by a thousand cuts. Although this isn’t a new problem for traders, these issues have been further compounded by the current “whiplash” market we find ourselves in.
What is a whiplash market?
What actions can we take to protect our accounts in these conditions?
How do the rules change in such conditions?
Let’s find out!
What is a whiplash market?
Have you ever watched price action when FOMC or other big data sets drop? The candle stick bars are aggressive in one direction and then turn without warning in the opposite way. In these moments every type of tool you are using to measure direction is redundant and the price action itself is equally redundant. This action eventually dies down and price begins to settle in a direction allowing traders to begin to choose an entry.
In a whiplash market, these violent rips in the fabric of price action happen suddenly, without warning and at key pivotal areas leaving both buyers and sellers wondering what just happened. Have a look at these examples below:
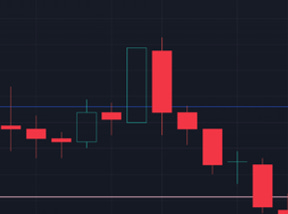
In the picture above you can see that we seemed to be holding onto a walnut level with a large bullish candle only for the move to be swept away from buyers with an immediate sell off.

A better example is the move above, a perfect hammer at our walnut level brings in buyers but as the sell off begins large high volume knives take price lower causing a run on stop losses.
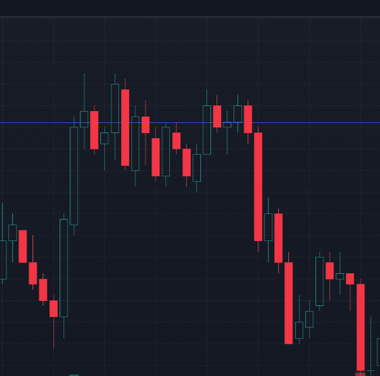
Zooming out a little, here is another example, price has broken higher and consolidated but as it begins to look like it is going even high, we knife aggressively lower.

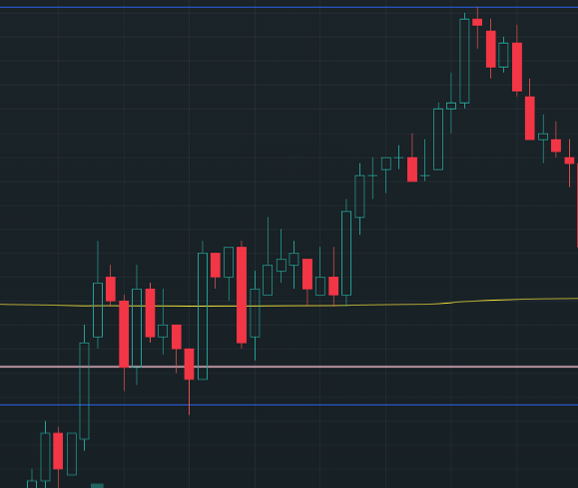
The last example above is one to make your stomach’s churn. Look at the constant red and green large bars that chop out both sides of the trade. Then suddenly an aggressive move upwards is thwarted and price sinks all the way back down as the real direction is revealed.
Trading in these conditions is tough. And since August we have seen some of the toughest markets to try and day trade in for years.
If you have been struggling, then don’t worry you are not alone and there is a way to make money even in these conditions but it requires RULES and those rules cannot be broken for each time you break a rule, you tighten the noose around your accounts inevitable demise.
What basic actions can we take to protect our accounts in these conditions?
Before I dive into some rules, I want to first set out some criteria for you. I am going to assume you are sensible and instead of trading your own money, you are trading an Apex account. Here are my recommendations for you first and foremost:
If you have a 100k account:
Do not trade more than 5 MES
Have a stop loss that is 16 ticks away
Have two targets from profit
Target 1 is 10 ticks away. Target 2 is 20 ticks away.
After target 1 is hit, your stop loss should move up from 16 ticks to 8 ticks away from your entry
The above is your safety blanket. If you have a 50k account then you can half the above.
Readers will know I do not recommend an account less than the 50k.
Okay, with positioning over with. Let’s move onto how and when to enter/exit a trade. Regular reader will know some of my absolute basics:
Never go long on a lower low
Never go short on a higher high
Never play breakouts, always wait for confirmation
Normally I would apply all of the above rules to the 1 minute chart, but these days I am finding that the 3m chart and the 5m chart help reduce the noise.
Okay, with the basics covered let’s move onto rules.
How do the rules change in such conditions?
Up until now, I have always been a proponent of having my levels and playing the above rules with them and not much else. However, as the market evolves, so do we. There are two additional times of levels that I now believe are crucial for every trader to have on their screen. Playing the rejection and reclaims of these have been working well and will continue to do so in my opinion.
Initial Balance
The initial balance is the high and low of the first hour of trading. Often it is a critical part of intraday price action. Take a look:

The action from Friday’s initial balance shows us that when sellers tried to flush below the IB (the white line) they were immediately rejected and this led to a big rally in the other direction right to the IB high. Annoyingly, there was no retest until the lower band for an entry using our method but the top and the bottom being touched in this way hopefully shows you how powerful these lines are. Not convinced?
How about this rally from Thursday. This time we reclaim the lower band and perfectly confirm the presence of buyers for our entry before rallying much higher. Where the initial balance and walnut align, this is often an area of real interest for me.
Value Areas
Value areas is a fancy was of referring to an areas where price found acceptance. The value area of the prior day is another key area that traders should always have on their charts. Have a look back at last week’s charts with the value areas drawn out for the prior day. You will see the following:
The sell off on Friday happened after we rejected Thursday’s value area low
The rally on Thursday failed at Wednesday’s value area low
The sell off on Wednesday happened only after Tuesday’s value area low stopped acting as support and became resistance.
On Tuesday, the value area for Monday played less of a role but initial balance was resistance into close
Monday saw Friday’s value area act as support twice before it failed at the third attempt leading to the huge sell off
I hope the above goes some way in helping you find some consistency in what can seem like an inconsistent market.
Of course, all of the above is completely wasted on you if:
You don’t follow the basic actions given above
You don’t respect price action
You trade impatiently trying to predict the action
You are obsessed with catching the very top and the very bottom
If the above list sounds like you, then forget about anything else I have said and instead focus on YOURSELF first. You must be in control of your emotions before you can become in control of your trading. This I will cover in more detail in next week’s special episode.
Until next time.
Much love.
PW
What Is Apex Prop Trading?
Don’t risk your own money until you are a consistent trader. Use Apex instead. I found my consistency using them. I wrote about it in detail here.
Click here to find out more and get a 90% lifetime discount with code SAVE90
What are Walnut Footprints & Sierra Chart?
I explain how to read my footprint chart here. You can download and use it for free!
I wrote a detailed breakdown of how to sign up for a 14 day free trial of Sierra here.
How Do I Get Into The Walnut Discord?
I want to grow our discord communities (clubs) so that they are self sufficient and a place of safety for newcomers. To do this we operate under a slow-growth policy, but to be added to the waiting list click here.
Would you be willing to show us on the charts where you consider Value Areas from the examples you gave? Or highlight it on another review?